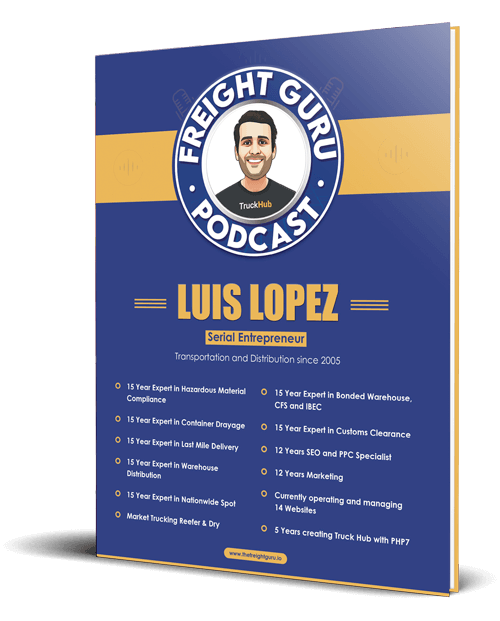
By Luis Lopez, AI transportation consultant, CEO of Go Hub.io Holdings Corp and subsidiaries, and host of the Freight Guru Podcast
A freight broker makes money in the gap between what a shipper pays and what a carrier accepts. That gap is set by capacity: how many trucks are available in a market compared with how many loads need to move. When capacity tightens faster than a broker expected, loads quoted last week get covered at a loss this week. When it loosens and the broker did not notice, the quote is too high and the freight goes to someone else.
Capacity forecasting is the attempt to see those shifts a little earlier. AI does not make the freight market predictable. It does make it possible for a small or mid-sized brokerage to watch more signals, on more lanes, than a person with a spreadsheet can manage.
What a capacity forecast actually is
A capacity forecast is a probability statement about a specific market over a specific period. A useful one sounds like this: outbound capacity from this region is likely to tighten over the next two weeks, and the cost to cover loads on these lanes will probably rise. A useless one is a single national number.
Freight markets are local and directional. A region can be flooded with trucks inbound and short of them outbound on the same day. Any tool worth using works at the level of a market or lane and separates equipment types, because dry van, refrigerated and flatbed capacity move on different schedules. The balance between headhaul and backhaul lanes is the reason direction matters so much.
The signals that matter
Your own data comes first
Brokers often overlook the best early indicators they have, which sit in their own transportation management system and phone logs:
- Time to cover. How long between posting or offering a load and booking a carrier. A lane that used to cover in an hour and now takes four is telling you something.
- Calls and offers per load. More outreach for the same result means fewer willing trucks.
- Carrier counteroffers. The gap between your first offer and where the carrier settles.
- Fall-offs. Carriers who accept a load and then give it back, usually because something better appeared.
- Routing guide behavior. Contract carriers declining loads they normally take.
- Margin by lane over time. Compression that appears before anyone has talked about it.
These signals are specific to your freight and your carrier base, and they move before published averages do. A model trained on them is forecasting the thing you care about, which is your cost to cover.
Market data adds context
External data fills in what your own book cannot see:
- Load-to-truck ratios on load boards, by market and equipment type
- Tender rejection rates, which show how often contract carriers decline freight
- The spread between spot and contract rates
- Diesel price trends, which affect carrier cost and willingness to reposition
- Import volumes and port activity, which lead inland truck demand
The calendar and the weather
Some capacity shifts repeat every year. Produce harvests pull refrigerated trucks into growing regions. Retail peak season raises demand ahead of the holidays. Month end and quarter end bring shipping surges. Major roadside inspection events and holidays remove trucks from the road for days at a time. Severe weather disrupts a region and then draws capacity toward recovery freight afterward. A model that includes these patterns will catch the routine swings, which leaves people free to think about the unusual ones. For the longer view, see the freight market cycle explained.
How the models work, in plain terms
Capacity forecasting is predictive AI, not the generative kind that writes text. A model studies historical patterns in the signals above and learns which combinations tended to come before a tightening or loosening market. It then scores current conditions against those patterns. If the difference between the two types of AI is unclear, generative versus predictive AI in freight covers it.
Generative tools still have a supporting role. They can turn a forecast into a short written brief for the sales team, or summarize why a lane was flagged. They should not be the source of the numbers.
Turning a forecast into decisions
A forecast has value only if it changes what someone does. In a brokerage, that means four areas.
Quoting
If a lane is likely to tighten before the pickup date, the quote should reflect the expected cost to cover on that date, not today’s. This matters most on freight quoted days or weeks ahead. Shorter quote validity on volatile lanes is a simple, honest way to manage the risk. The mechanics are covered in AI freight quoting and pricing.
Contract commitments
Brokers who bid on contract freight are making a fixed-price promise across a market that will move. A forecast helps decide which lanes to bid firmly, which to price with more cushion and which to decline. It also informs conversations with shippers about how spot and contract freight are balanced, the subject of contract versus spot freight rates.
Carrier relationships
When tightening is expected, the time to secure trucks is before it arrives. That means calling core carriers early, offering consistent freight and paying on time so your loads are the ones they keep when choices multiply.
Customer communication
A shipper who hears about a tightening market a week ahead can adjust lead times or ship early. A shipper who hears about it when the truck does not show up remembers that differently. Sharing what you see, with appropriate humility about uncertainty, is a service competitors often skip.
Where forecasts fail
- Shocks. A model learns from history. A sudden regulatory change, a port disruption or an unexpected economic event has no pattern to match. Forecasts are least reliable exactly when the stakes are highest.
- Thin data. A lane you run twice a month does not produce enough history. The model will either borrow from similar lanes or guess, and you should know which.
- Stale inputs. A forecast built on last month’s data in a market that moves weekly is a history report.
- False precision. A rate predicted to the cent implies certainty that does not exist. Prefer tools that give a range and a confidence level.
- Everyone reading the same signal. When many brokers act on the same public indicator, the advantage shrinks. Your own operational data is the part competitors cannot copy.
Questions to ask before relying on a tool
- At what level does it forecast: national, regional, market or lane?
- Does it use my own transaction data, market data or both?
- How often is it refreshed?
- Does it show a range and explain the main drivers behind each forecast?
- Can I see how past forecasts compared with what happened?
- What does it do with lanes that have little history?
The fifth question is the one that matters most. Keep your own scorecard as well. Each week, record what the tool predicted for your top lanes and what you actually paid. After a few months you will know how much weight to give it.
Start smaller than you think
A brokerage does not need a data science team to begin. Tracking time to cover, offers per load and margin by lane each week, and reviewing the trend every Monday, captures a meaningful share of the value. Software becomes worth paying for when the number of lanes exceeds what a person can watch.
For more on reading the freight market with clear eyes, subscribe to the Freight Guru Podcast.
About the author: Luis Lopez is a Miami-based AI transportation consultant and logistics entrepreneur, the CEO of Go Hub.io Holdings Corp and subsidiaries, and host of the Freight Guru Podcast.