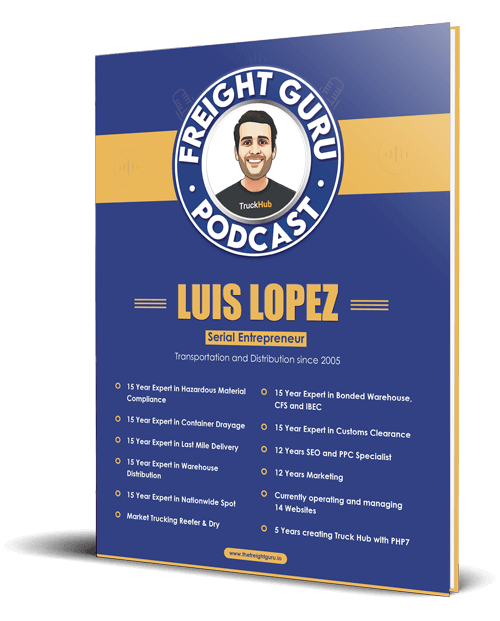
By Luis Lopez, AI transportation consultant, CEO of Go Hub.io Holdings Corp and subsidiaries, and host of the Freight Guru Podcast
Most shippers already have a demand forecast. Sales builds one, finance builds one, and planning usually builds a third. What is often missing is the step that turns that forecast into a freight plan: how many trucks, on which lanes, in which weeks, and how much capacity to commit to carriers in advance. AI can help close that gap, but only if you understand what the translation involves and where it breaks.
This article explains how order history and sales forecasts become truck counts and lane volumes, what data you need to do it well, and where forecasts most often fail.
Why a sales forecast is not a freight forecast
A sales forecast is usually expressed in units or revenue, by product and by month, often at a national or regional level. Carriers do not move revenue. They move shipments with a specific origin, destination, weight, cube, and pickup date. Converting one into the other requires several layers of assumptions:
- Where the demand ships from. Which warehouse or plant fulfills each customer or region.
- How it ships. Full truckload, LTL, parcel, or intermodal, depending on order size and service level.
- How it packs. Units per case, cases per pallet, pallets per trailer, and whether weight or cube limits the load first.
- When it ships. Order-to-ship lead times, customer delivery windows, and day-of-week patterns.
Each layer adds error. The goal of AI in this process is not to produce a perfect number, but to apply these conversions consistently and update them as the business changes.
How AI turns order history into lane volumes
The most reliable starting point is your own shipment and order history. Models learn the relationship between what was ordered and what actually moved: which orders consolidated into one truck, which went LTL, how loads were built, and how volume on each lane rose and fell over the year.
From there, a typical workflow looks like this:
- Forecast demand at a useful level. By customer region and product family, by week, rather than total units by month.
- Assign demand to origins. Use your fulfillment rules to map each region to the facility that serves it.
- Convert units to physical freight. Apply pack and pallet data to get pallets, weight, and cube.
- Convert freight to shipments by mode. Use historical order-size patterns to estimate what share moves as truckload versus LTL.
- Roll up to lanes and weeks. The output is expected loads per lane per week, with a range rather than a single number.
That last point matters. A good freight forecast says something like “between 18 and 26 loads per week on this lane in this period,” not just “22.” The range is what lets you decide how much to commit.
From lane volumes to capacity commitments
Once you have lane volumes with ranges, you can make practical decisions. As an AI transportation consultant, this is the part of the conversation I focus on, because this is where the forecast starts to save or cost money.
- Contract the base, flex the peak. Commit to carriers for the volume you are confident in, typically near the low end of the range, and plan to cover the rest with backup carriers or the spot market.
- Share forecasts with carriers. Carriers plan equipment and drivers too. Telling them what is coming, and how confident you are, makes you easier to serve.
- Plan dedicated or drop-trailer programs only where volume is steady. Lanes with stable weekly volume are good candidates; lanes that swing widely usually are not.
- Prepare for known peaks early. If the forecast shows a seasonal surge, secure capacity before the market tightens. This peak season freight planning guide covers the timing.
Brokers face a mirror image of this problem from the capacity side, which is covered in this piece on AI capacity forecasting for freight brokers.
The data you actually need
Shippers often assume they need a large data science project. In practice, the inputs are mostly data you already own, but scattered across systems:
- Order history with dates, customers, ship-to locations, and quantities.
- Shipment history with origin, destination, mode, carrier, weight, pallets, and pickup and delivery dates.
- Product master data: case and pallet configurations, weights, and dimensions.
- Fulfillment rules: which facility serves which region, and when that changes.
- The sales or demand forecast, plus a calendar of planned promotions and launches.
The hardest part is usually linking orders to shipments. If your order system and transportation system do not share a reliable key, the model cannot learn how orders become loads. Getting these records into one consistent view is the foundation, which is why I recommend reading about building a single source of truth for freight data before buying any forecasting tool.
Where forecasts fail
Every forecast is wrong to some degree. The useful question is where it is likely to be wrong, so you can plan around it.
Promotions
Promotions create spikes that do not look like normal history. If the model is not told about a promotion, it will underforecast the spike and then overforecast the weeks after, when customers have already stocked up. Promotions need to be fed in as explicit inputs, with their timing and expected lift.
New products
A new product has no history. Models can borrow patterns from similar products, but pack configuration, customer mix, and ramp speed are often different. Treat new-product freight as a separate, lower-confidence layer and keep extra flexible capacity for it.
Network changes
Opening a warehouse, changing which facility serves a region, or switching a large customer from collect to prepaid can redraw lanes overnight. History from before the change can mislead the model. These changes must be built into the fulfillment rules before the forecast runs.
Customer behavior shifts
Large customers sometimes change order frequency or minimum order sizes. Fewer, bigger orders can shift freight from LTL to truckload even if total units stay flat. Watch order-size patterns, not just volume.
Calendar effects
Holidays, quarter-end pushes, and weather events distort weekly patterns. This overview of seasonal freight patterns is a good reference for the effects most shippers need to model.
Keep a feedback loop
A freight forecast should be compared to actual loads every week. Track the error by lane, look for consistent bias in one direction, and feed the results back into the model and the commitment decisions. A forecast that is reviewed and adjusted regularly will outperform a more sophisticated one that is set once and forgotten. The aim is steady improvement in how well your freight plan matches what actually ships.
For more conversations on freight and AI, subscribe to the Freight Guru Podcast.
About the author: Luis Lopez is a Miami-based AI transportation consultant and logistics entrepreneur, the CEO of Go Hub.io Holdings Corp and subsidiaries, and host of the Freight Guru Podcast.